Power BI is a popular platform for business intelligence because it has dynamic graphics and tools that are easy to use. In the middle of its analysis tools is something more basic: Power BI semantic models. These models add structure to the link between raw data and reports, making it possible for users to understand, change, and share data in a way that is uniform and flexible.
This article will talk about what Power BI semantic models are, how they work, what their main parts are, and why they're so important for current data analysis processes.
What Are Power BI Semantic Models?
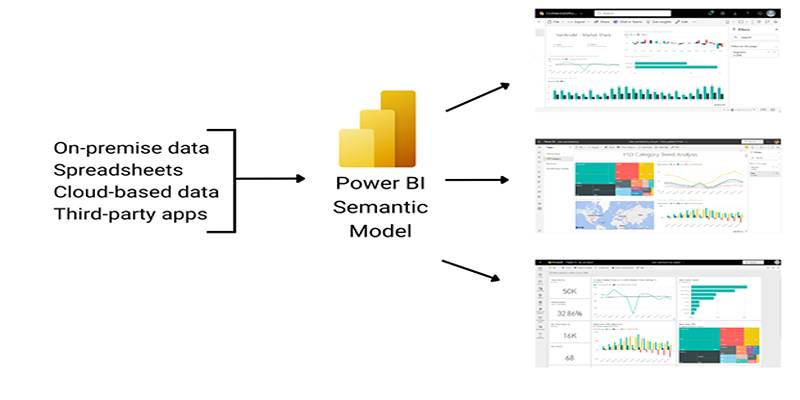
Power BI semantic models are logical representations of data that include not just the data itself but also the relationships, calculations, and business logic necessary to make sense of it. Think of them as the blueprint or brain behind Power BI reports. Instead of connecting reports directly to data sources, semantic models act as a middle layer that cleans, structures, and explains the data in human-friendly terms.
They are more than just datasets. They define how data connects, what measures are calculated, and how users can interact with that data through visual reports.
Core Components of a Semantic Model
A typical Power BI semantic model is made up of several key elements:
- Tables: Represent sets of related data. Each table includes rows (records) and columns (fields).
- Relationships: Connect tables through shared fields, allowing users to pull together data from different sources seamlessly.
- Measures: Calculations defined using DAX (Data Analysis Expressions). These include totals, averages, percentages, and other KPIs.
- Calculated Columns: Columns derived from existing data using DAX formulas.
- Hierarchies: Define levels within dimensions, such as Year > Quarter > Month > Day for date data.
- Roles: Control what different users can see using row-level security.
Each of these elements plays a role in transforming raw information into meaningful insights.
Modes of Power BI Semantic Models
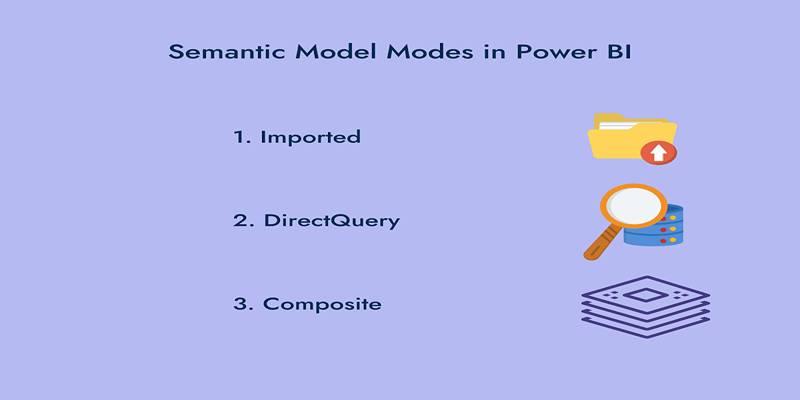
When building a semantic model, Power BI offers different modes for connecting to and processing data. These modes influence performance, data freshness, and query behavior.
Import Mode
In import mode, Power BI copies the data into its internal storage engine (VertiPaq). This mode offers the best performance because data is stored in-memory, allowing fast access and rendering. However, it requires periodic refreshes to stay current.
DirectQuery Mode
Instead of copying data into Power BI, DirectQuery keeps the data in its original source and queries it in real-time. It’s ideal when working with large datasets or when you need up-to-date data, but performance may depend on the source system.
Composite Mode
This hybrid option allows you to use both import and DirectQuery within the same model. For example, you might import historical data and use DirectQuery for current, frequently changing data. This offers flexibility and balances performance with freshness.
Building a Power BI Semantic Model in Five Steps
Creating a semantic model in Power BI Desktop follows a structured process:
- Connect to Data: Choose your sources and decide whether to import data, use DirectQuery, or combine both.
- Transform Data: Clean and shape your data using Power Query. This includes removing duplicates, fixing formats, and filtering rows.
- Define Relationships: Link tables using primary and foreign keys to allow cross-table analysis.
- Create Measures and Calculated Columns: Write DAX formulas that calculate key performance metrics or create new fields for analysis.
- Publish and Share: Upload the semantic model to Power BI Service so others can build reports on top of it.
Once published, a semantic model becomes a shared resource, supporting multiple reports and users.
Why Use Semantic Models in Power BI?
One of the biggest advantages of Power BI semantic models is that they promote reusability and consistency. Teams no longer need to recreate data logic for each report. Instead, they can connect to a central semantic model and build on it.
Here are more reasons to use them:
- Centralized Logic: All metrics and calculations are defined in one place, reducing the chance of inconsistent numbers across reports.
- Performance Optimization: Using pre-aggregated or in-memory data speeds up report loading and user interaction.
- Security Control: Apply row-level security to restrict access based on roles, protecting sensitive data.
- Time Savings: With the model already handling the heavy lifting, report creators can focus more on storytelling.
Managing Power BI Semantic Models
After publishing a semantic model to Power BI Service, proper management is crucial to ensure it remains secure, usable, and reliable.
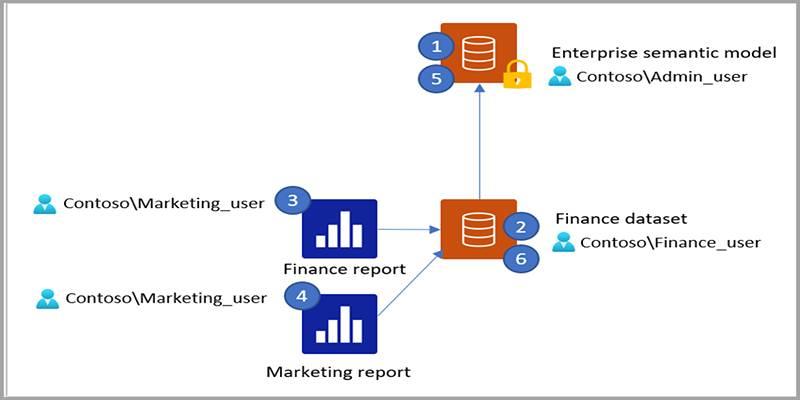
Permissions and Access
Power BI provides granular control over who can view or use semantic models. Permissions include:
- Read: Users can access existing reports but cannot create new ones.
- Build: Allows users to create new reports based on the model.
- Reshare: Enables users to grant access to others.
- Write: Permits users to edit and republish the model.
Semantic model owners can define these settings for individuals or groups, supporting collaborative reporting without compromising data integrity.
Security Controls
Admins can enforce policies that limit sharing or modification of semantic models. Features like row-level security (RLS) allow the same report to show different data depending on who is viewing it, making it ideal for role-based reporting.
Certified or promoted models can be marked as official within an organization, guiding users toward trusted sources.
Best Practices for Semantic Models
To get the most out of Power BI semantic models, follow these best practices:
- Use a Star Schema: Organize data in fact and dimension tables for cleaner relationships and better performance.
- Limit the Number of Models: Avoid creating many redundant models. Use shared models wherever possible.
- Optimize DAX Calculations: Avoid overly complex or inefficient formulas that could slow down performance.
- Apply Security Early: Define access roles and RLS at the beginning of the project, not as an afterthought.
- Monitor Usage: Use the Power BI Service to track how models are being used and identify opportunities to consolidate or improve them.
Conclusion
Power BI semantic models bring structure, clarity, and scalability to the data analysis process. Instead of building visuals on top of raw, unstructured datasets, teams can rely on a robust layer that organizes data, defines calculations, and enforces security—all while enabling multiple reports to use the same logic and structure.
By learning how to design and manage these models effectively, you not only streamline your Power BI reporting but also improve collaboration, performance, and data trust across your organization. Whether you're just starting with Power BI or scaling enterprise-wide analytics, semantic models should be at the center of your data strategy.